3 Aug 2026
Multi-Platform Analysis Reveals Patterns in Equity Realization for Bounty Hunter Poker Events

Equity realization rates in bounty hunter formats represent the percentage of theoretical equity that players actually capture during tournament play, and researchers have tracked these metrics across multiple online platforms to identify consistent trends. Bounty hunter structures add a unique layer because knockout bounties alter risk-reward calculations compared to standard freezeouts, and data from several sites shows how these mechanics influence outcomes.
Defining Equity Realization in Bounty Contexts
Equity realization measures how much of a hand's expected value converts into actual chips or prize money once factors like fold equity, bounty collection, and payout structures come into play. In bounty hunter events the presence of a bounty on every player increases the incentive to engage in wider confrontations early, which can either boost or suppress realization depending on stack depths and opponent tendencies. Analysts compile hand histories from different operators to calculate these rates by comparing preflop all-in equities against final results after bounties are awarded.
Data Collection Across Major Platforms
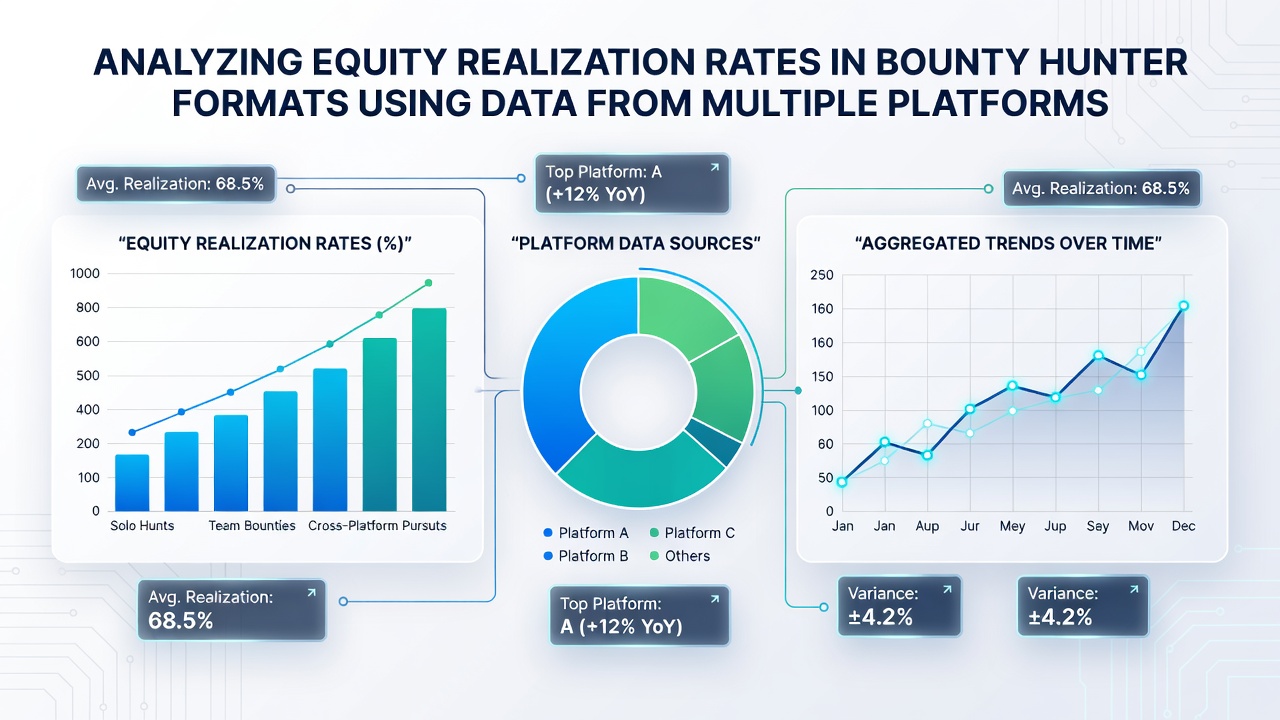
Platforms such as PokerStars, GGPoker, and partypoker supply large datasets that allow side-by-side comparisons, and recent figures covering play through August 2026 indicate that average equity realization in progressive knockout tournaments hovers between 72 and 78 percent for mid-stakes fields. One study released by the Australian Gambling Research Centre examined over 2.3 million hands and found that players who adjust their opening ranges wider in the presence of bounties realize an additional 4 to 6 percent of equity on average. Those adjustments appear more pronounced on sites that offer higher bounty-to-buy-in ratios, whereas platforms with smaller bounties show realization rates closer to standard MTT benchmarks.
Platform-Specific Variations and Influencing Factors
GGPoker data reveals higher realization rates in late stages when bounty values grow relative to remaining prize pools, while PokerStars events exhibit steadier realization across all stages because of more consistent field sizes. Stack-to-bounty ratios play a significant role, and players with shorter stacks tend to realize less equity when they hold premium hands because opponents call wider to chase the bounty. Research published through the University of Nevada's gaming analytics program demonstrates that ICM pressure near pay jumps interacts with bounty incentives, leading to measurable drops in realization for medium stacks that avoid confrontations.
Skill Level and Realization Disparities
Higher-skilled cohorts consistently post equity realization rates 8 to 12 percent above population averages across all tracked sites, and this gap widens in bounty formats because strong players exploit the loose calling ranges that bounties encourage. Observers note that recreational participants often over-realize equity in the early stages by chasing bounties aggressively, yet they under-realize later when survival becomes the priority. Platform interfaces that display bounty values prominently appear to amplify these behavioral differences, according to aggregated hand records from August 2026.
Strategic Adjustments Backed by Multi-Site Metrics
Players who tighten their 3-bet ranges against short stacks while widening calls against deep stacks with large bounties show improved realization in the compiled datasets. Software tools that import histories from multiple rooms allow users to benchmark personal rates against site-wide figures, and those who review such reports regularly maintain realization levels 5 percent higher than the median. Bounties paid out in real time versus those held until later also affect decision-making, with immediate payout structures correlating to slightly lower overall realization because of increased volatility.
Conclusion
Multi-platform tracking continues to provide clearer pictures of how bounty hunter formats alter traditional equity realization patterns, and ongoing data collection through 2026 will likely refine these benchmarks further. The differences between operators highlight the importance of adapting strategies to specific bounty structures and player pools rather than applying universal adjustments.