19 Aug 2026
Database Queries Reveal Patterns in Multi-Table Cash Game Deception
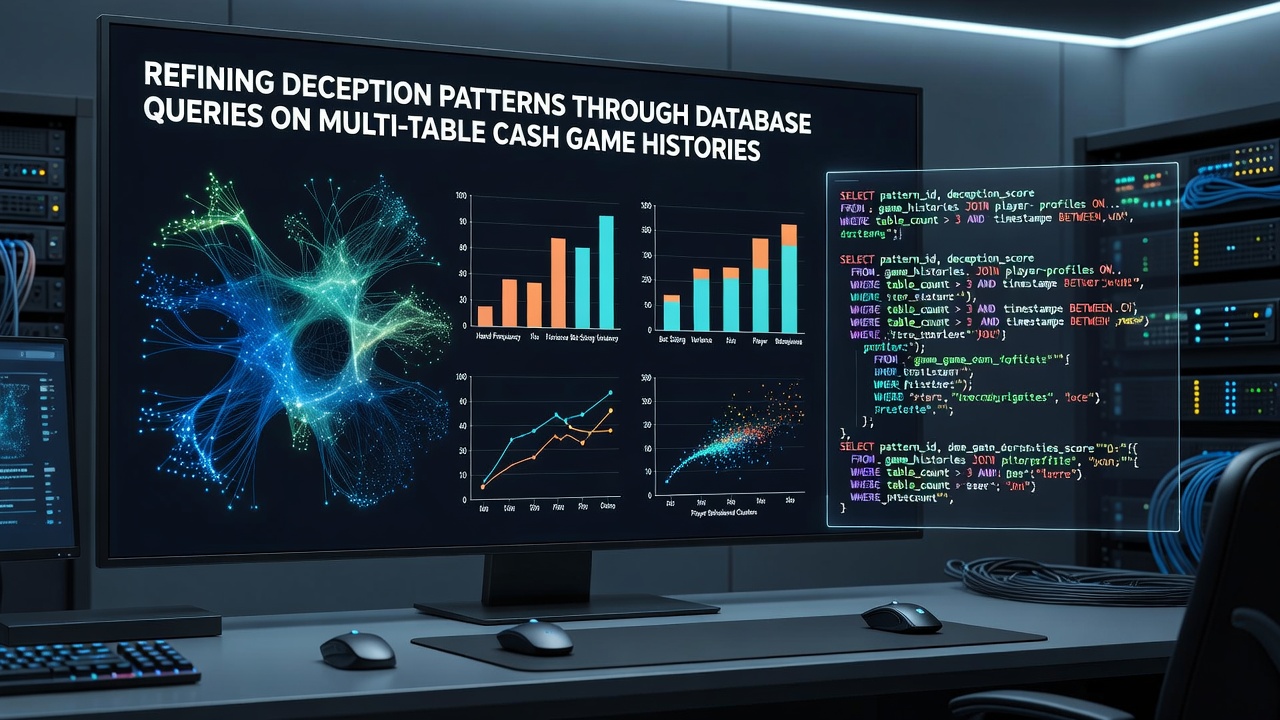
Multi-table cash game histories contain structured records of every action across dozens of simultaneous sessions, and analysts turn to database queries to isolate deception indicators such as continuation bets that never reach showdown or river raises that fold out stronger holdings. These queries operate on normalized tables that store player identifiers, position data, board textures, and bet sizing sequences, allowing researchers to filter for specific scenarios while maintaining statistical significance across thousands of hands. Data from industry reports compiled through 2026 shows steady growth in the volume of tracked hands, particularly during peak summer months when online traffic increases.
Structuring the Data for Pattern Extraction
Tables typically separate hand metadata from individual action logs, so effective queries join player statistics with street-by-street decisions using common keys like hand_id and player_id. Analysts apply conditions that flag discrepancies between a player's range construction and actual outcomes, such as checking back strong hands on earlier streets only to lead aggressively later. One study from a Canadian research institution examined over 2.4 million hands and found that players who varied their bet sizes on coordinated boards showed measurable differences in fold equity capture compared with those who used static sizing.
Position and stack depth further refine the filters because deception opportunities shift dramatically when effective stacks exceed 100 big blinds versus shorter depths. Queries often incorporate window functions to calculate rolling frequencies for actions like check-raises or delayed continuation bets, revealing whether a player adjusts these frequencies based on recent results or maintains consistent patterns across sessions. Observers note that such calculations become reliable once sample sizes per player exceed several thousand hands in similar game types.
Identifying Specific Deception Indicators
Common query patterns target river aggression after missed draws or check-raise frequencies on paired boards where the aggressor rarely holds the trips. By grouping results by villain position and board runout category, analysts isolate spots where bluff-to-value ratios deviate from theoretical expectations. Figures from an Australian gambling research center indicate that multi-tabling regulars adjust these ratios more frequently than single-table players, yet the adjustments remain detectable through aggregated data rather than isolated observations.

Seasonal comparisons add another layer because summer 2026 traffic spikes coincided with changes in game selection, as many regulars migrated toward higher-stakes tables during vacation periods. Queries that segment data by month can expose whether deception patterns intensify or relax under increased volume, and cross-referencing with bonus rollover requirements shows some correlation between volume targets and more polarized betting lines. Those who maintain detailed archives often discover that players returning from breaks exhibit temporarily elevated aggression metrics before settling back into baseline frequencies.
Applying Results to Strategy Refinement
Once patterns surface through repeated queries, players incorporate the findings into pre-session preparation by reviewing opponent-specific reports generated from the same database. Filters can highlight opponents who over-fold to river raises on certain textures or who under-bluff when checked to on the turn. A report issued by the European Gaming and Betting Association documented how access to such granular data has influenced training regimens at several professional stables, with coaches assigning query-based homework rather than relying solely on video review.
Validation remains essential because small sample distortions can produce misleading signals, so analysts routinely run the same queries across multiple date ranges and game stakes before drawing conclusions. Cross-validation against public hand histories from major rooms further strengthens reliability, particularly when regulatory filings from jurisdictions like those in the Isle of Man or Malta provide aggregate traffic statistics that contextualize individual findings.
Conclusion
Database queries applied to multi-table cash game histories supply a systematic method for surfacing deception patterns that would otherwise remain hidden within raw hand data. As tracking volumes continue to expand through 2026 and beyond, the precision of these queries improves, offering clearer distinctions between noise and exploitable tendencies across positions, stack depths, and board textures. The approach integrates well with existing analysis workflows, turning large datasets into actionable adjustments without requiring manual review of every session.