17 Aug 2026
Cross-Platform Fold Equity Calculations in Bounty Hunter Poker Tournaments
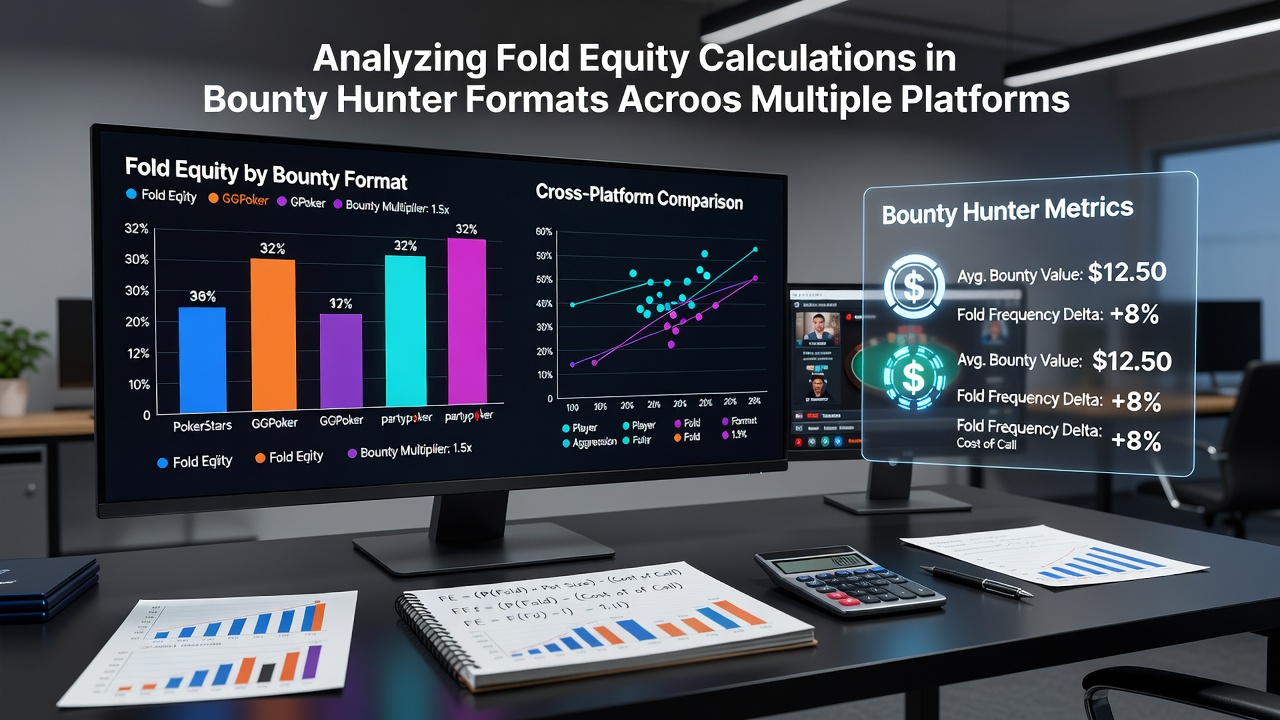
Platform operators structure bounty hunter formats with distinct bounty mechanics that alter standard fold equity formulas, and observers note these variations appear across major sites in 2026. Fold equity represents the portion of a pot a player expects to win when an opponent folds, calculated as the probability of a fold multiplied by the current pot size plus any additional value from bounties in knockout structures.
Core Mechanics of Fold Equity in Bounty Formats
Traditional fold equity calculations focus on pot odds and range interactions, yet bounty hunter tournaments introduce a second layer because knocking out opponents yields direct cash rewards. Researchers in game theory applications to poker have documented how players adjust calling ranges when bounty values exceed standard chip equity thresholds. On sites using progressive knockout models, a portion of each bounty carries forward into future eliminations, which changes the expected value of a fold versus a call at every stage of the tournament.
Data from multiple platforms shows that early-stage bounty hunter events produce higher fold equity incentives because remaining bounties retain full value, whereas late-stage dynamics shift as stacks shorten and payout structures tighten. Those who track hand histories across operators report that players defend wider ranges when bounties represent a larger percentage of their total equity, particularly when the bounty exceeds 20 percent of the effective stack.
Platform-Specific Bounty Structures and Their Impact
Different operators apply unique multipliers and progressive percentages that modify fold equity thresholds. One major site allocates 50 percent of a bounty to the eliminator while the remaining 50 percent carries forward, creating situations where players calculate both immediate bounty capture and future equity from the progressive pool. Another platform uses a fixed bounty system without progression, which keeps fold equity calculations closer to classic independent chip model frameworks.

According to industry reports from the European Gaming and Betting Association, operators updated their bounty algorithms in mid-2026 to include dynamic multipliers based on field size, which further influences when fold equity becomes profitable. Players who study these differences adjust their preflop three-bet and four-bet frequencies depending on the specific site's bounty allocation rules.
Calculation Adjustments Across Operators
Basic fold equity formula adapts when bounties enter the equation: FE = (Fold% × Pot) + (Fold% × Bounty Value) – (Call% × Opponent Equity Realization). Observers tracking solver outputs note that platforms with higher progressive carry percentages produce larger adjustments to calling ranges in the middle stages. Those reviewing aggregated data from August 2026 tournaments found that average fold frequencies dropped by roughly 4 to 7 percent in progressive formats compared with fixed-bounty events at equivalent stack depths.
Software tools used by serious players now incorporate platform-specific bounty sliders, allowing users to input the exact progressive percentage and recalculate equity on the fly. These adjustments prove most pronounced when effective stacks fall between 15 and 30 big blinds, the zone where bounty pressure most heavily influences decision points.
Data Patterns From Major Sites
Hand history databases reveal consistent patterns: sites with higher bounty-to-stack ratios generate more frequent all-in confrontations before the money bubble. Regulatory filings from the Malta Gaming Authority and comparative studies published by academic groups at the University of Nevada, Reno indicate that player behavior converges toward higher variance strategies when bounty equity exceeds chip equity by a measurable margin. Figures from recent series show that average fold equity realization in bounty hunter events sits approximately 12 percent lower than in standard freezeout formats at the same blind levels.
Cross-platform comparisons also highlight differences in late-registration rules that affect starting bounty distribution adn therefore alter early fold equity calculations. Operators that permit late entry with full bounty allocation create different dynamics than those that prorate or reduce bounties for late registrants.
Conclusion
Platform variations in bounty allocation directly reshape fold equity mathematics, and players who track these differences maintain more accurate range constructions across events. Data collected through 2026 demonstrates measurable behavioral shifts tied to each site's specific progressive mechanics, while solver outputs continue to refine the precise thresholds where bounty value overtakes traditional pot odds. Those analyzing aggregated results across operators gain clearer insight into optimal decision points as bounty hunter formats evolve.